Reports
Every operational metric the platform produces — revenue, payouts, messages, occupancy — lives under Reports.
In this section
- Reports Hub (this page) — the landing page that points to each report
- Revenue Report — per-property revenue breakdown
- Payout Report — owner payouts owed and paid
- Messages Report — message volume + AI/human split
- Revenue Simulation — forward-looking what-if tool
- Reservation Report — the operator-friendly reservation table
Reports Hub
The Reports landing page (/v28/reports) lists every report with a one-line summary.
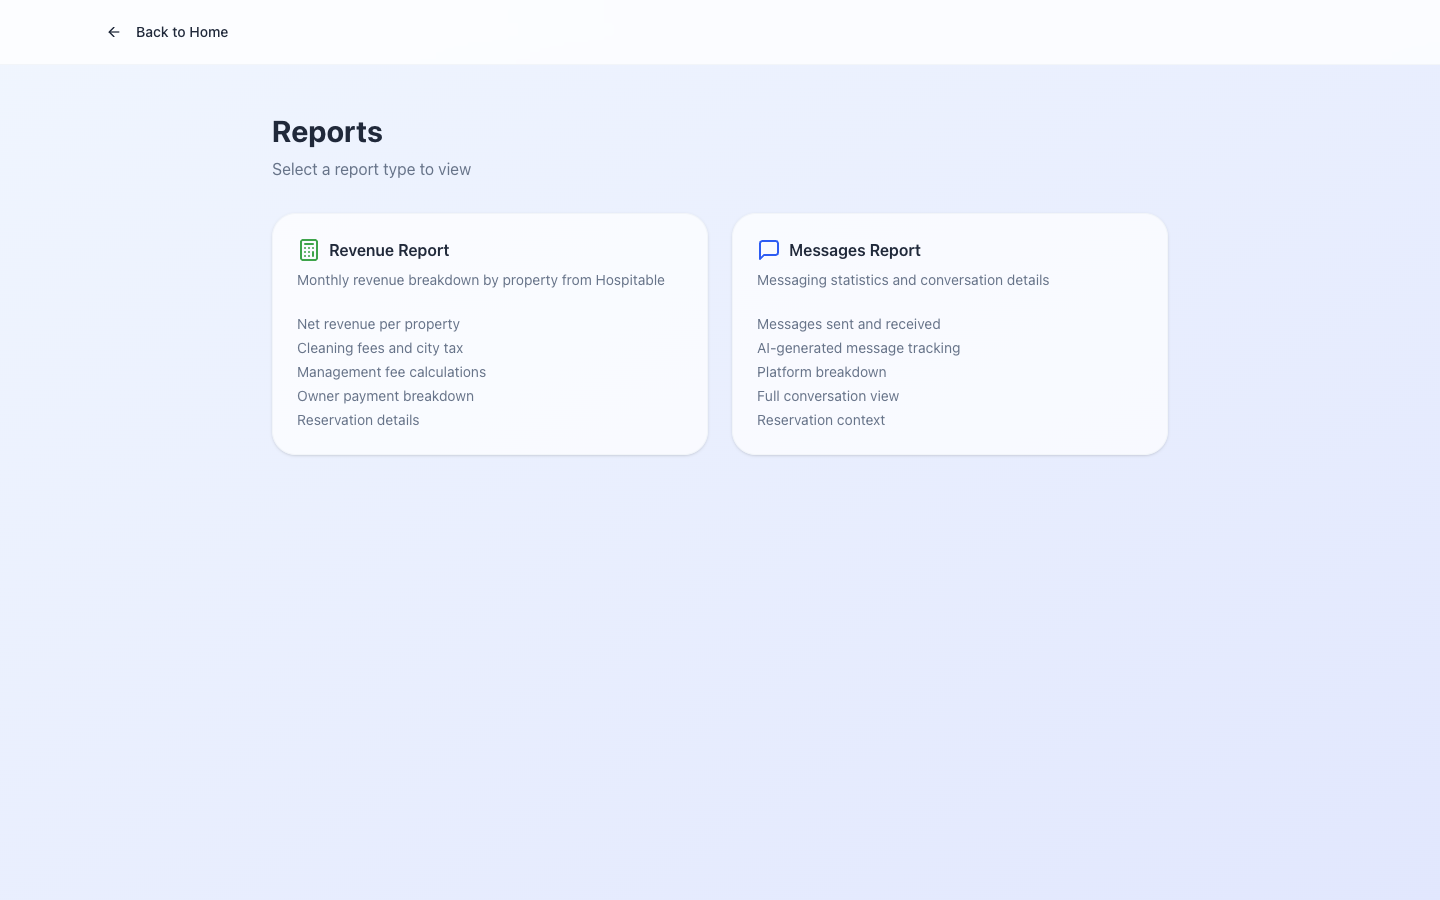
Each tile links to the report. Reports respect tenant boundaries — you only see data for the tenant you're logged into.
V28 vs legacy
Many reports have a V28 version (newer design, faster, paginated) and a legacy version at /metrics (older, but historically more complete). After #161 the V28 versions are nearly at feature parity with /metrics; the Simulation report is the last gap, addressed in the same ticket.
After #213, the V28 Payout Report's From/To filter inputs are wired correctly — they were dead UI before, and MARK N PAID would have marked all-time unpaid records as paid (data-integrity risk avoided).
Date filters
All reports take a From/To date range:
- From defaults to start of the current month.
- To defaults to today.
- The filter applies to the report's primary date column (Revenue Report → check-in date; Payout Report → payout-due date; etc.).
Related issues
- #161 — V28 Reports completeness vs legacy
/metrics; Simulation added. - #213 — V28 payout report From/To filter wired.
- #116 — invoice/financial code extraction (developer-side; no operator-visible change).